
PDU Fleet Solution
Power is the one resource your data center can't oversubscribe.
The Parlon PDU Fleet Solution gives operations and facilities teams a live, fleet-wide view of rack power, thermal conditions, and cost, down to a single PDU. Cross a breaker's rating and the result is an unplanned outage, not a warning.
PDU and Power Monitoring for the AI Datacenter Buildout
The problem
Most infrastructure monitoring was built to watch servers and networks. It wasn't built to watch the PDUs feeding them.
Rack density keeps climbing, and power, not floor space or compute, is often the first thing operators run out of. Cross a PDU's breaker rating and the result is an unplanned outage, not a warning.
Teams are left reconciling vendor-specific power figures by hand and finding out about a breaker limit at the moment it trips.
Cost of downtime reported by 41% of enterprises. A breaker trip doesn't check your budget first. (ITIC, 2024)
See it in action
Walk through the PDU Fleet console.
The One Resource Your Data Center Can't Oversubscribe: Parlon PDU Fleet Demo
What it does
A fleet-wide view of rack power, down to a single PDU.
Fleet-wide power & thermal
Real-time total power, peak draw, fleet load percentage, and average inlet temperature across every rack, filterable by site, feed, and vendor.
Breaker-proximity ranking
Every PDU ranked by how close it is to its breaker limit, so the rack most at risk is always the first thing on the page.
Feed redundancy at a glance
Load bars colored by feed show whether the partner side can carry the load if one feed drops, before it becomes an incident.
Cost & carbon modeling
Model electricity rate, grid carbon intensity, and PUE to see what fleet power draw actually costs, in dollars and carbon, ranked site by site.
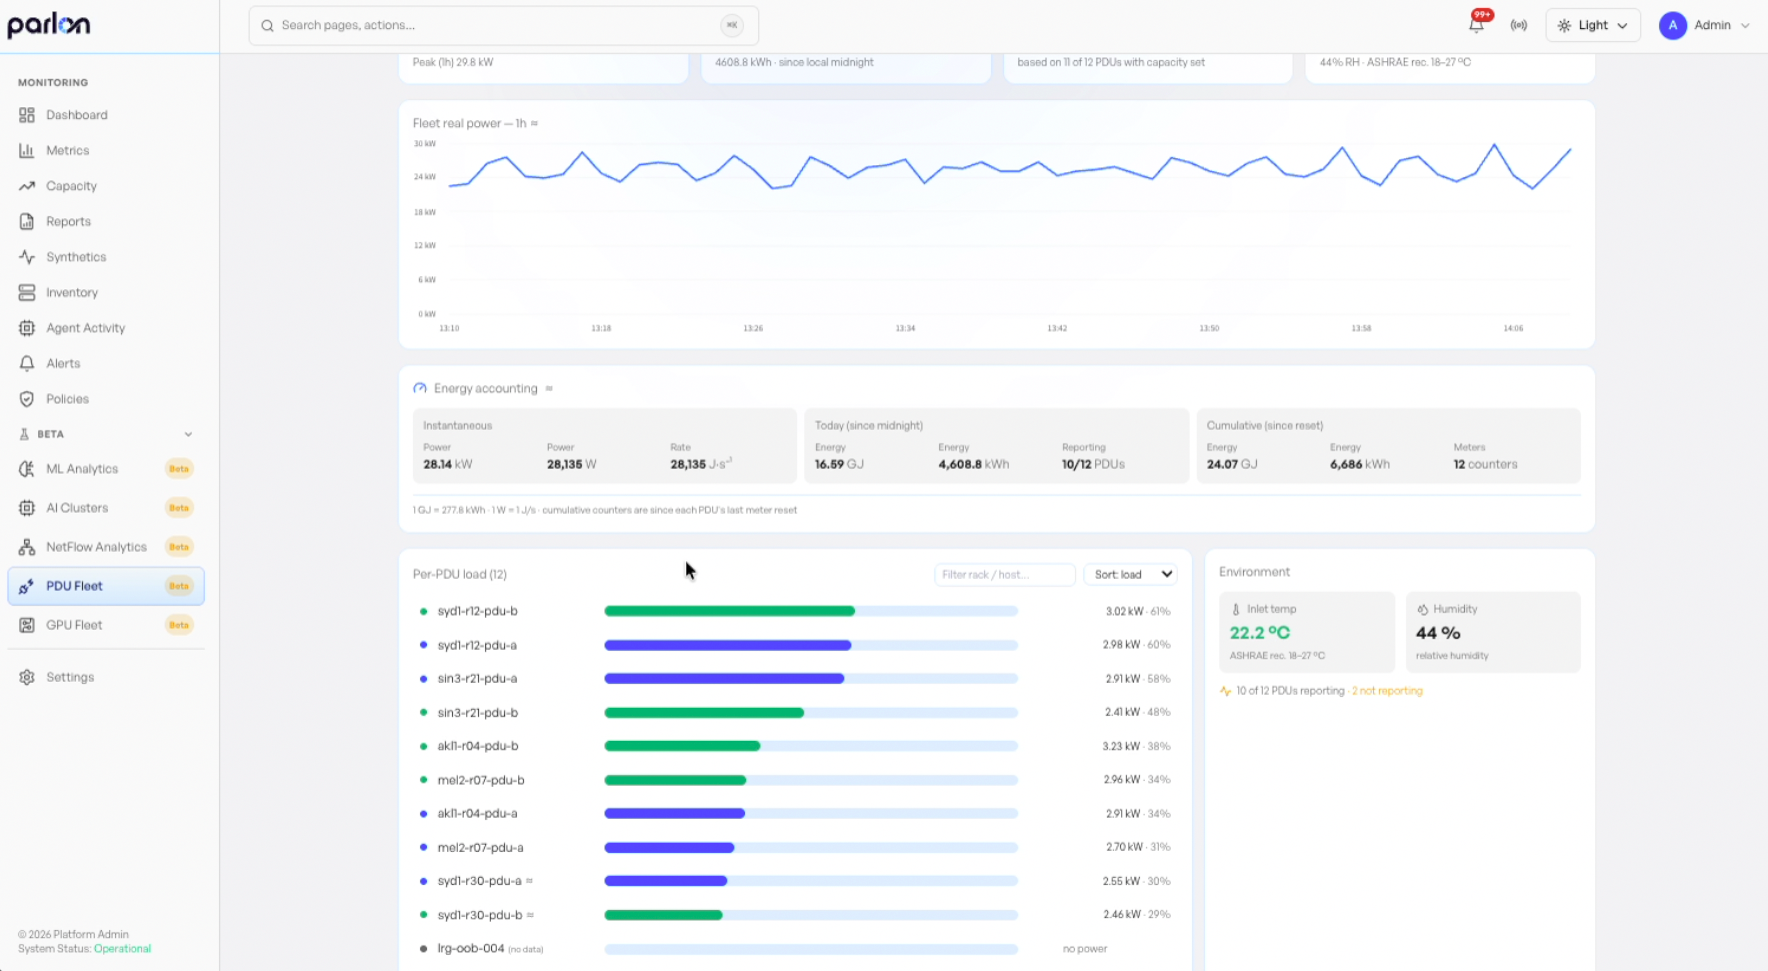
The Overview tab: fleet stat cards, real-power trend, energy accounting, and per-PDU load ranking in one view.
Breaker proximity, ranked
The rack most at risk is always the first thing on the page.
Every PDU ranked by load against its breaker rating, with feed A and feed B shown separately, so redundancy risk is visible before a feed actually drops.
Working scenarios
Built around how operations and facilities teams actually work.
Onboarding a new PDU
- Confirm it appears in the per-PDU load list once SNMP resolves its vendor
- Open its inline "Set capacity" editor
- Enter rated capacity, breaker rating, phase count, site, rack, and feed
- Save. Its load badge, and the fleet-wide load %, now reflect real headroom
Building a rack power budget
- Filter to the site and feed you're planning around
- Note each rack's breaker rating and current load % in the per-PDU list
- Cross-reference against the Capacity page's compute headroom for the same racks
- A rack can run out of power before it runs out of compute, or the reverse. Check both
Deployment & coverage
Reconciling vendor-specific power figures by hand, solved.
PDU telemetry flows through the same Normalization Engine as every other infrastructure source, so a rack's power data sits on the same data model as the compute and network signals around it.
We'll walk through the console against your own rack layout and show you where your real headroom is, feed by feed.