
GPU Fleet Solution
GPUs are the most expensive thing in your data center, and the hardest to see clearly.
The Parlon GPU Fleet Solution gives capacity planners and on-call engineers a live, fleet-wide view of GPU health, utilization, and waste, down to a single device. A fleet averaging a healthy-looking 45% utilization can still be half maxed out and half sitting idle.
GPU Fleet Monitoring for the AI Datacenter Buildout
The problem
Most infrastructure monitoring wasn't built to separate a GPU that's healthy from one that's actually doing work.
A cluster-average dashboard hides the one device that's actually failing. A thermal-throttled GPU or a rising ECC/XID error count degrades a training run or a serving fleet long before any cluster-level metric moves.
A GPU fleet averaging a healthy-looking 45% utilization can still be half maxed out and half sitting idle. Averages hide exactly the problem you're trying to find.
See it in action
Walk through the GPU Fleet console.
The Most Expensive Thing in Your Data Center: Parlon GPU Fleet Demo
What it does
A fleet-wide view of GPU health, down to a single device.
Fleet-wide health & thermal
Live visibility into utilization, temperature, and error counters across every GPU in the fleet, not a cluster average.
Utilization & waste detection
Find the idle capacity hiding behind a healthy-looking fleet average before it shows up as a budget conversation.
Per-GPU drill-down
Go from fleet view to a single device in one click when a number looks wrong.
Expert Mode hardware deep-dive
Full hardware telemetry for the engineers who need to go deeper than the fleet dashboard.
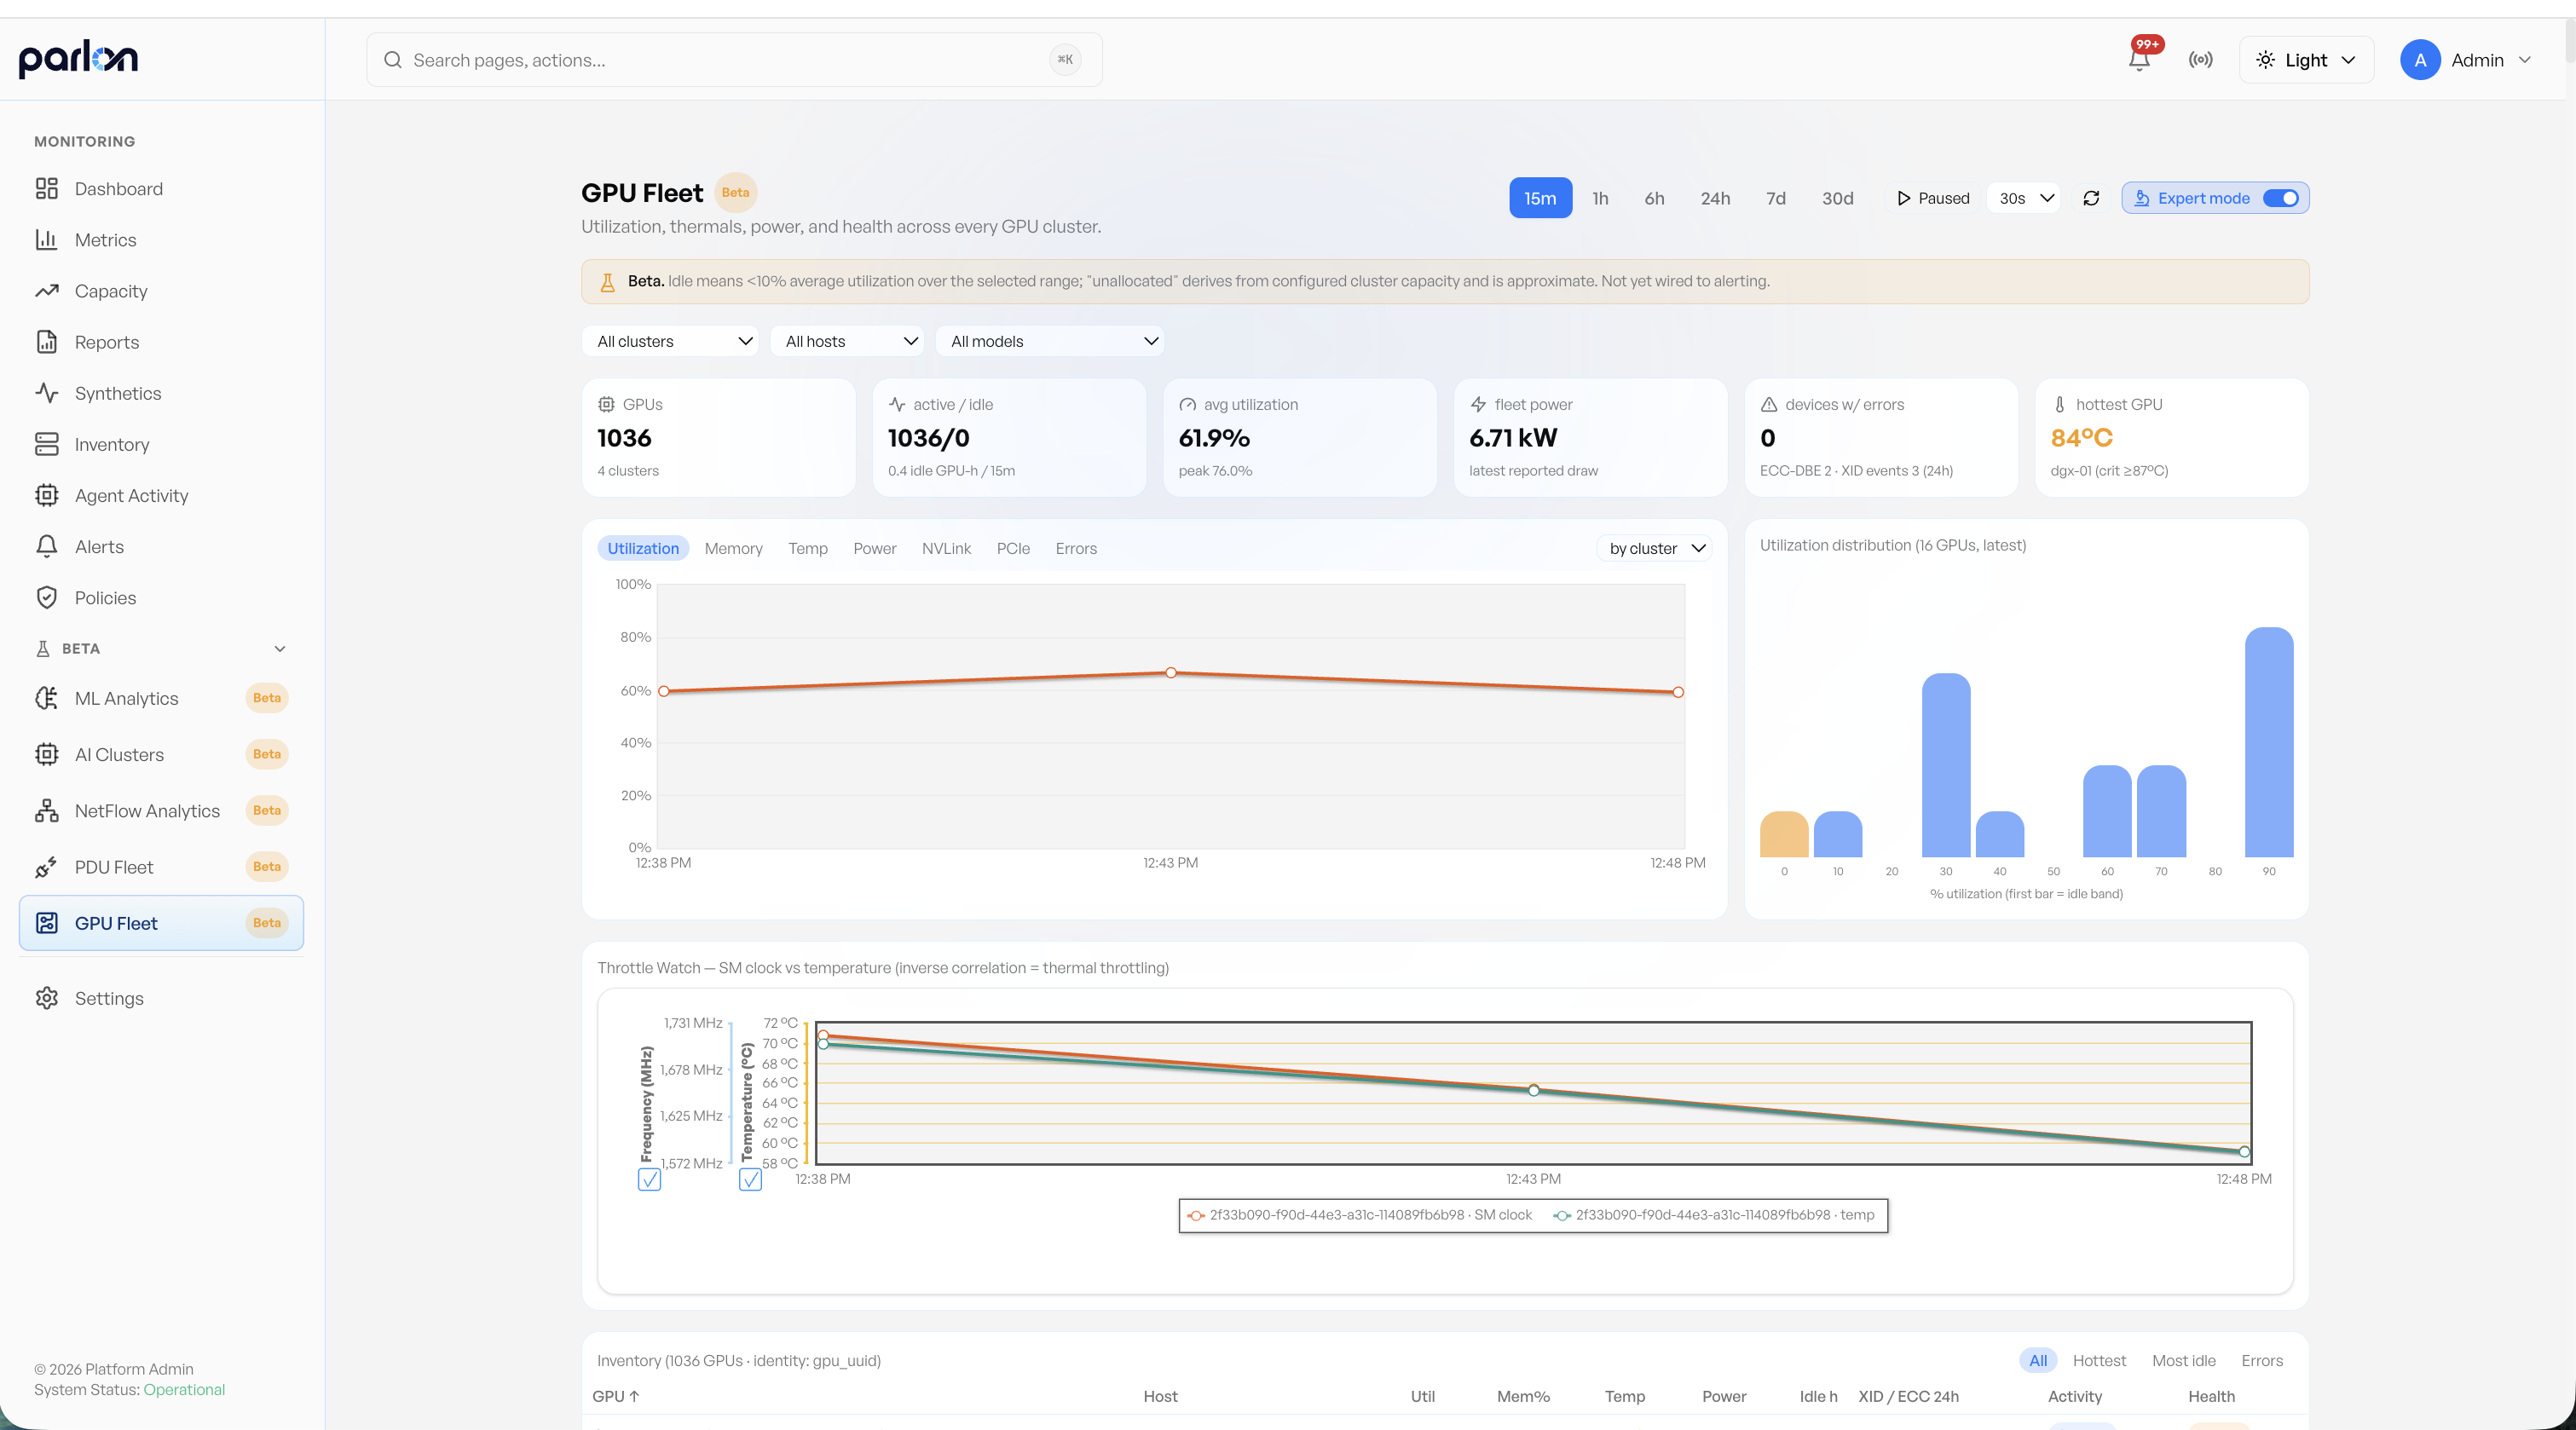
The GPU Fleet console: per-device utilization, thermal, and error data alongside the fleet-wide view.
Working scenarios
Built around how capacity planners and on-call engineers actually work.
The morning fleet check
Did anything change overnight, and is capacity being used? Open the 24-hour view, scan the histogram for idle capacity changes, and check error devices by cluster.
Chasing a thermal event
The hottest GPU hits 87°C. Sort inventory by temperature, open the drill-down for health reasons, and check whether clocks dip as temperature peaks. If they do, heat is already costing performance.
Is the fleet actually busy?
Leadership wants a straight answer. Group trend panels by cluster over 7 days, read the histogram for busy buckets versus the idle band, and use the "Most idle" preset to find reclaimable capacity.
Deployment & coverage
One data model, broad hardware coverage.
One data model
GPU telemetry flows through the same Normalization Engine as every other infrastructure source. Every reporting GPU also appears in Parlon's unified asset inventory, alongside the rest of your monitored estate.
Broad compatibility
Reads standard NVIDIA DCGM telemetry, so any DCGM-instrumented data-center GPU is supported out of the box.
We'll walk the console against your own fleet and show you exactly where the idle capacity and thermal risk are hiding.