
Active Synthetic Monitoring
Outside-in, inside-out, and everywhere between.
Legacy synthetic tools test from cloud regions down to your endpoints. That's outside-in, and it's not full coverage. Parlon runs synthetic tests from outside your network, from inside it, and probe-to-probe between every location you operate, unified with continuous telemetry in one native system.
The coverage gap
Outside-in coverage misses what's happening between your own locations.
2:47am. A branch office loses 30% packet loss on the path to your data center. Your cloud-only monitoring tool shows green. Your users won't know until 9am.
Legacy synthetic tools test from cloud regions down to endpoints: outside-in coverage. They miss what happens on internal network paths and between locations. Parlon runs outside-in tests and adds synthetic checks from behind firewalls and probe-to-probe between sites, for full-spectrum coverage.
Legacy synthetic monitoring
Outside-in only.
- Probes deployed in cloud regions, not behind your firewall
- Tests external endpoint availability; misses internal path degradation
- No probe-to-probe monitoring between sites or locations
- Separate modules for synthetics and telemetry: two panes of glass
Parlon active monitoring
Outside-in and inside-out.
- Deploy behind the firewall, at branch sites, or fully air-gapped
- Continuous probe-to-probe monitoring between every location
- Synthetics and telemetry in a single native system: one pane of glass
- Alert Auto-Tune™ learns your environment and cuts noise ~70%
Maturity check
Where does your team sit on the curve?
Crawl, walk, run, fly: four stages of synthetic monitoring maturity, and a checklist for evaluating where you actually are versus where the dashboard says you are.
Synthetic Monitoring Maturity Model: Crawl → Walk → Run → Fly (Buyer's Checklist)
Why it's different
Built for a network that was never entirely public.
Legacy synthetic monitoring was built when whole networks lived in public cloud regions, so outside-in testing was sufficient. Networks changed. The architecture didn't. Probes still live exclusively in the cloud, telemetry sits in a separate product, and correlation happens after the fact.
| Capability | Legacy synthetic monitoring | Parlon |
|---|---|---|
| Probes behind the firewall | Not supported | Docker or Kubernetes, no inbound ports |
| Probe-to-probe monitoring | Not supported | RTT, jitter, packet loss, path bandwidth |
| Air-gapped deployment | Not supported | SSH-pull architecture, in production today |
| Synthetics + telemetry, native | Separate products | One platform, one data model |
| ML-based alert noise reduction | Static thresholds | ~70% noise cut, confirmed with live customers |
Check types
Every check type your stack needs, including the one your current tool skipped.
Ten check types cover the full surface area of modern infrastructure, from the TCP port to the database query. Every type runs on every probe model: global, local, edge, and air-gapped.
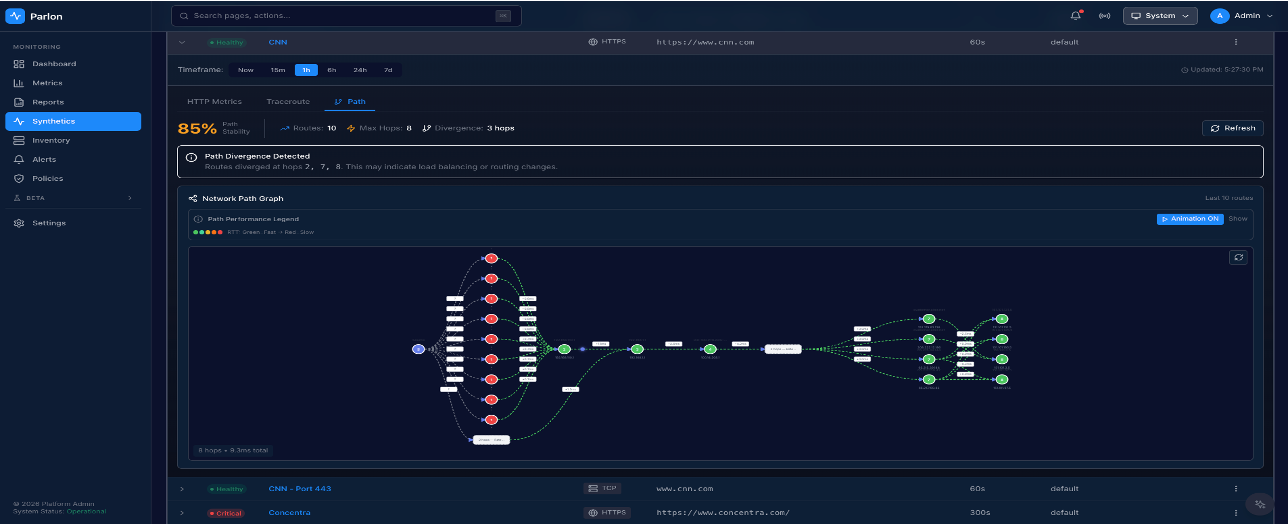
The active monitoring dashboard: check results and network path metrics in one view.
Network measurement
Not just up or down. How the path is actually behaving.
RTT
Continuous latency measurement between every probe pair. Baseline drift is caught before it crosses a threshold you'd notice.
Jitter
Latency variance, critical for real-time, voice, and video. Jitter trends surface routing instability before it hits users.
Packet loss
Pinpointed per hop, not just "somewhere on the path." Know if it's your network, your ISP, or your cloud provider.
Path bandwidth
Active bandwidth measurement between locations. Know your actual available capacity, not just what your contract says.
MCP validation for AI and LLM workflows is included above as a standard check type. For the deeper AI infrastructure story, GPU fleets, power and PDU, and agent activity, that's the AI Infrastructure Observability page.
See AI Infrastructure ObservabilityAlert Auto-Tune™
The noise problem is architectural. So is the fix.
Static thresholds fire on anything that crosses a line. That's not intelligence, it's a spreadsheet. 67% of network observability alerts are noise, and teams have adapted by ignoring them, which means real problems get missed too.
Learns your baseline
Analyzes historical alerts and normalized telemetry to understand what normal looks like for your environment. Adapts as infrastructure changes.
Recommends smarter thresholds
AI-generated recommendations suppress low-impact noise while preserving real operational risk. No manual tuning cycles.
Correlates and de-duplicates
Related alerts from the same root cause consolidate into a single escalating stream. One alert per incident, not one hundred.
Keeps getting better
Re-tunes continuously as your environment evolves and fixes are applied, so the floor keeps dropping, not just in week one.
Evidence
Live from day one, in a fully air-gapped environment.
A healthcare enterprise operating 1,000+ clinic locations consolidated two vendors into Parlon, in a single on-premise, air-gapped, HIPAA-compliant deployment. Synthetic checks were active within hours.
“We found Parlon's capabilities beyond parity with the legacy vendors, and the simplicity of deployment and the cost were a significant value in themselves.”
— Network Infrastructure Lead, healthcare enterprise
Deploy anywhere
Deploy the way your security team requires, not the way your vendor allows.
All four modes are feature-equivalent. No capability tiers, no "enterprise add-on" for on-premises. The platform you evaluate is the platform you deploy.
SaaS
Fastest path to value. No infrastructure to manage. Updates happen automatically.
On-premises
Fully installed in your own infrastructure via Docker or Kubernetes. Complete data residency control.
Hybrid
Cloud-managed control plane with on-premises data collection. SaaS simplicity, on-prem data locality.
Air-gapped
Fully isolated via SSH-pull architecture. No external connectivity required. In production today.
We'll walk through the platform against your specific infrastructure and show you what the TCO looks like against what you're running today.
Run a synthetic validation test